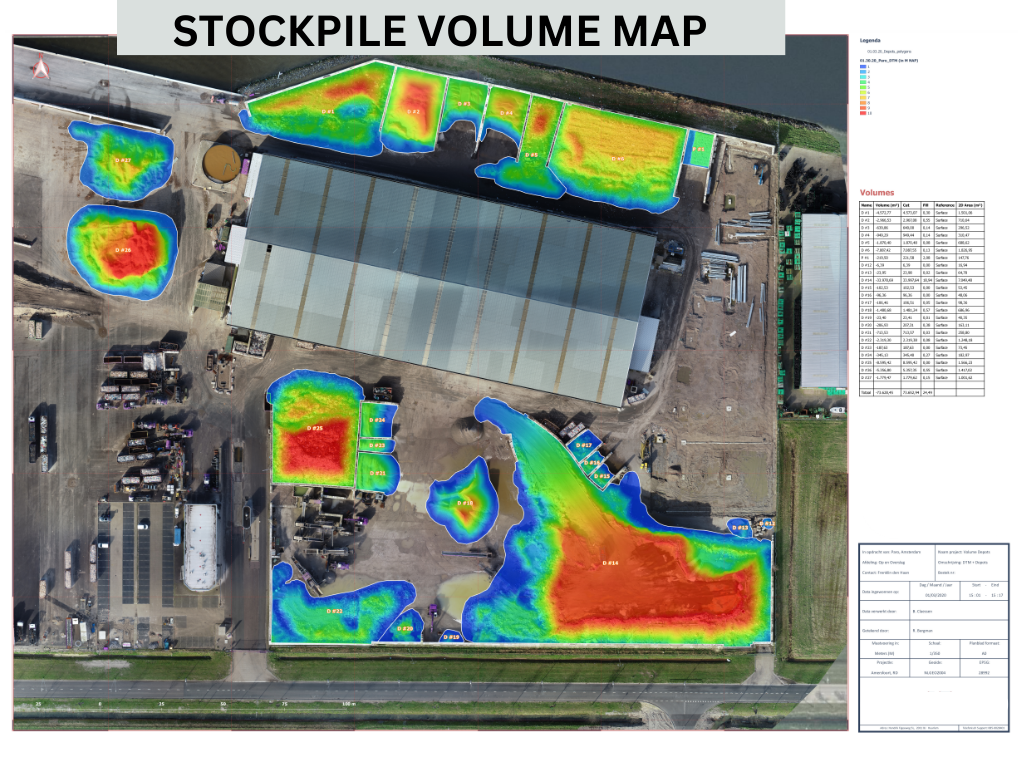
Drone Imagery Processing to calculate Volume of Stock-Piles
Using the power of Virtual Surveyor and QGIS 97% acurate volume of Stock Piles is being calculated for construction material production factories in Holland
Team Members:
Muhammad Hamza
Drone Spec:
DJI Mavic Pro
Affiliation:
Fiverr
Software Used:
Virtual Surveyor
Quantum GIS
Objective
Weekly Monitoring
Team Members:
Muhammad Hamza
Drone Spec:
DJI Mavic Pro
Affiliation:
Fiverr
Software Used:
Virtual Surveyor
Quantum GIS
Objective:
Weekly Monitoring
This project aims to calculate the volumes of Stock-piles using data collected from drones equipped with elevation sensors and Multispectral Sensors (MSS). The report details the methodology, data processing steps, and findings obtained through the analysis.
The primary objectives of this project include:
This section outlines the step-by-step process followed in the project:
The findings and outcomes obtained from the project are summarized as follows:
Location
Holland
Project Deliverables:
Please feel free to contact me at my email address or through my LinkedIn Account below.
mhwahla360@gmail.com